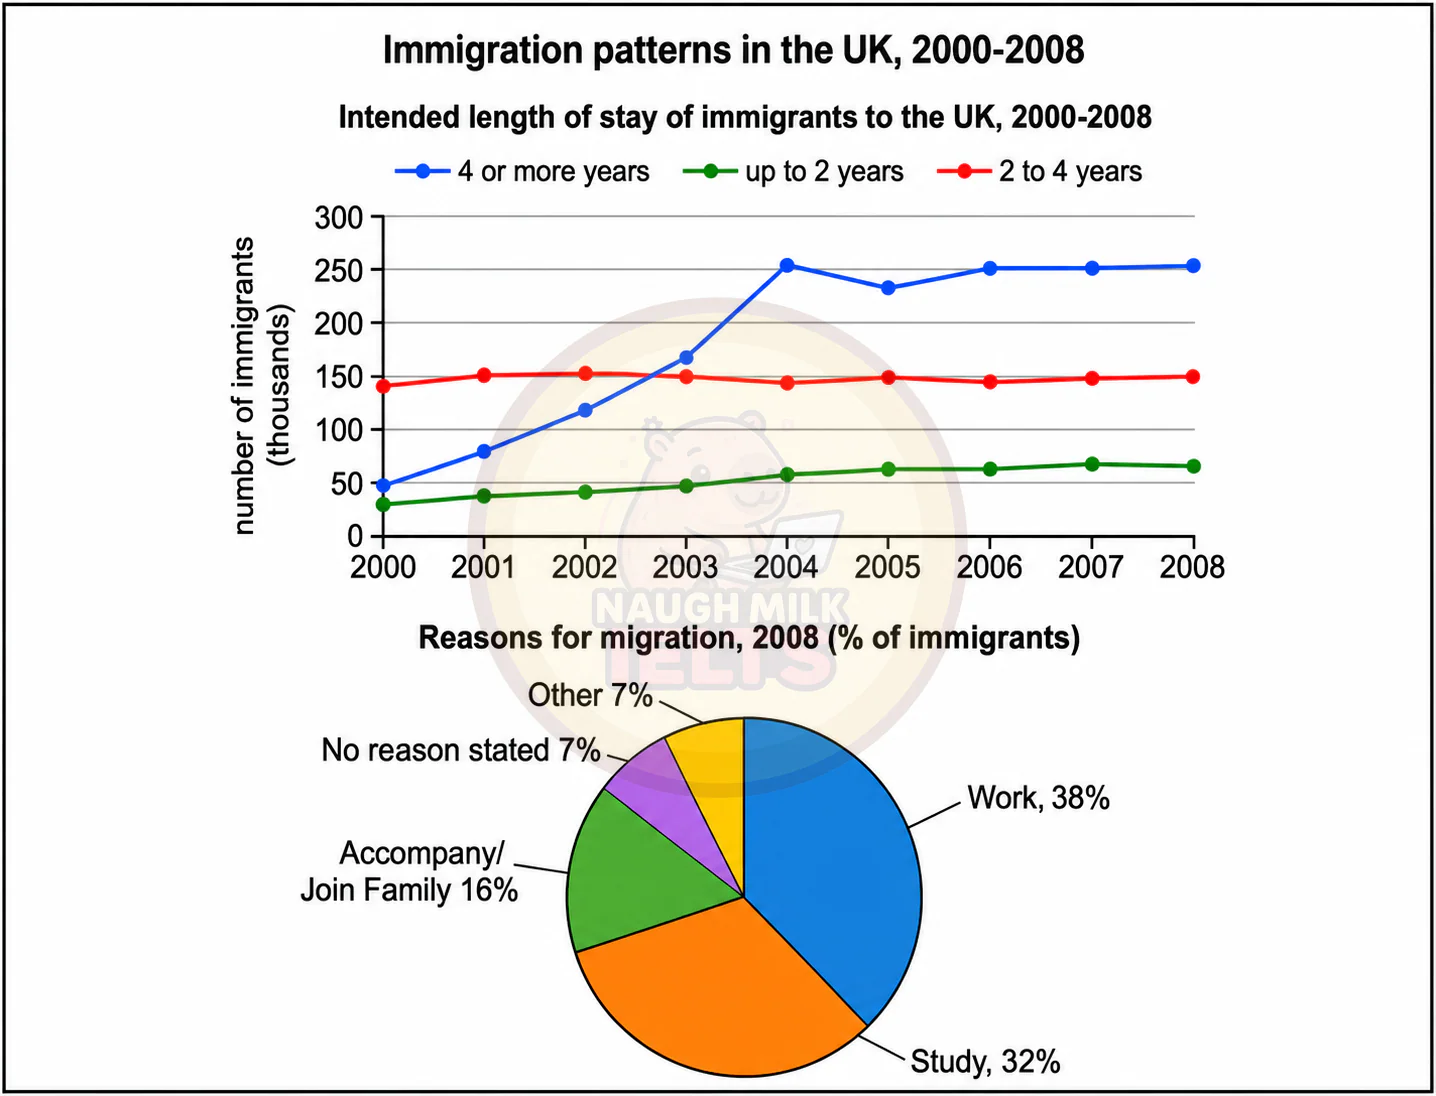
Task 1: The graph and chart give information about migration to the UK between 2000 and 2008. The line graph shows the intended length of stay of immigrants. The pie chart shows the reasons for migration to the UK in 2008.
Bài thi IELTS WRITING gồm 0 câu hỏi, thời gian 20 phút, chia thành 1 phần.
Task 1: The graph and chart give information about migration to the UK between 2000 and 2008. The line graph shows the intended length of stay of immigrants. The pie chart shows the reasons for migration to the UK in 2008.