
arrow_backQuay về

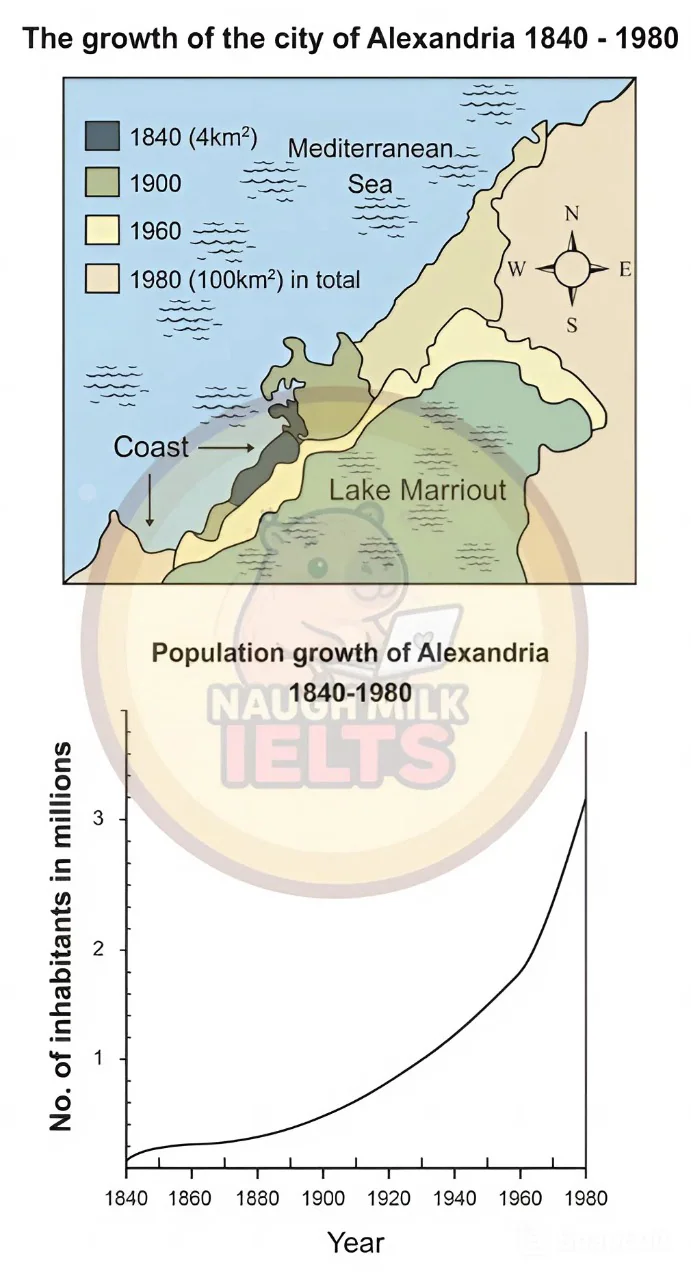
Task 1: The map and graph below show the growth in the physical size and population of the Egyptian city of Alexandria between 1840 and 1980.

Bài thi IELTS WRITING gồm 0 câu hỏi, thời gian 20 phút, chia thành 1 phần.

Naugh Milk IELTS
✍️ IELTS WRITING
Task 1: The map and graph below show the growth in the physical size and population of the Egyptian city of Alexandria between 1840 and 1980.

descriptionTổng quan

Task 1: The map and graph below show the growth in the physical size and population of the Egyptian city of Alexandria between 1840 and 1980.

categoryCác dạng câu hỏi

Chưa có thông tin về các dạng câu hỏi
historyLịch sử làm bài

lock

Đăng nhập để xem lịch sử làm bài và lưu kết quả.

✍️